


Enter Tableau. At Archetype, our team needed a better way to support our performance review process. Using our own Tableau expertise, we designed an employee performance review method which incorporates the ‘360° feedback’ concept by aggregating the data from managers, peers, and employee themselves. Once we uploaded the information into the Tableau dashboard, we created strong visualizations, allowing our management team to quickly know what employees did well and see the space where they could improve.
Let’s share with you what we did.
USE REVIEW FORMS TO COLLECT THE PERFORMANCE DATA FROM EMPLOYEES
In an organization where employees have several different skills, our team had to decide which skills all employees needed to have. Ultimately, we chose eight required skills. Under each skill level, there are different tasks to show competence and employees must achieve all of the tasks under that skill level achieve it. After an employee completes the form, our team loads the data into the database. We then use Tableau to connect to the database and create visualizations for the management team to see each employee’s performance.
CREATE VISUALIZATIONS TO ALLOW MANAGEMENT TO EVALUATE AGAINST THE SKILL SETS
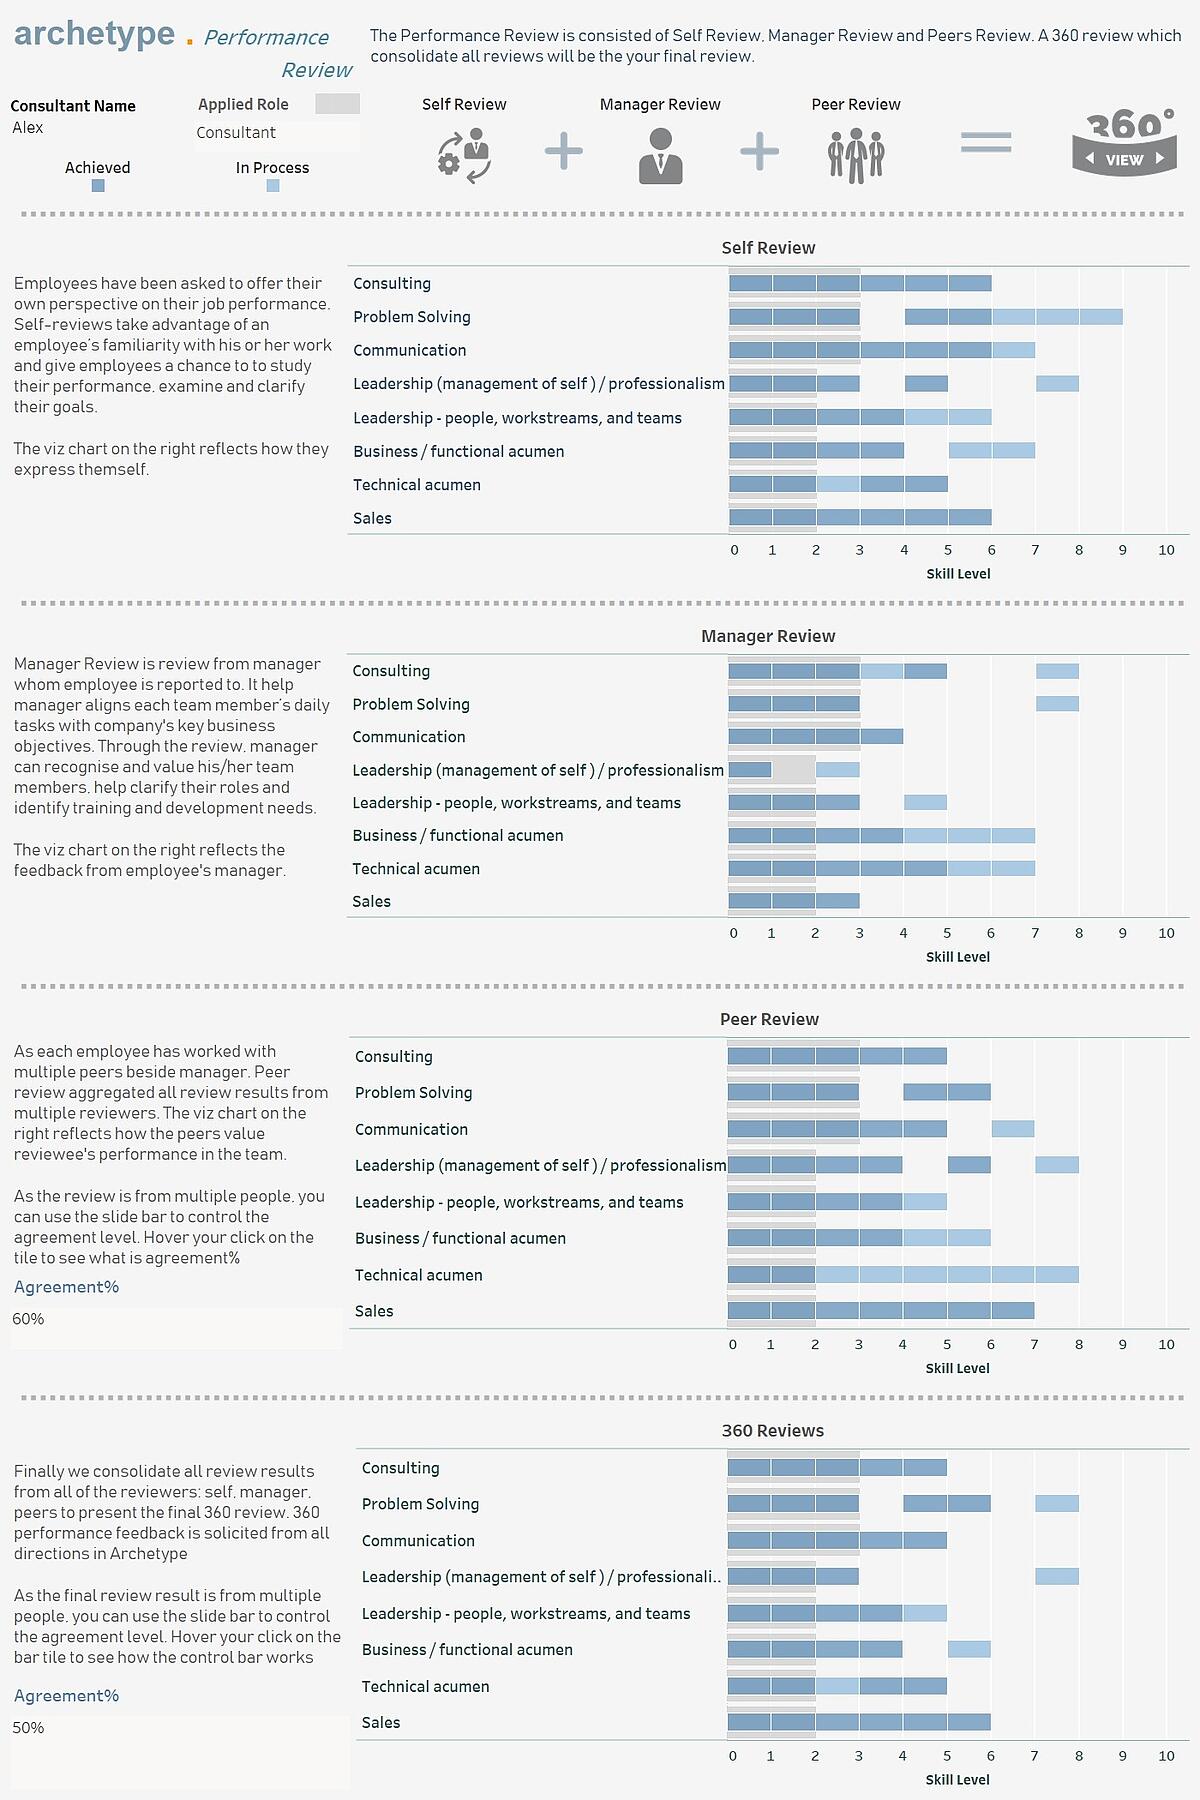
As you see in the dashboard, the management team can select the name of an employee and the role level they want to evaluate against. Each section of review listed all eight required skills and the grey bar shows the required skill level for the Applied Role managers select. For example, if a manager selects ‘Consultant’ in the Applied Role filter, the grey bar indicates that the required Consulting level for a Manager is 3 and required Technical acumen level is 2. The darker blue bar indicates the skill level the employee has achieved, and the lighter blue bar indicates the skill level the employee has not achieved but in the process of achieving it. If it’s blank, it indicates the employee failed to achieve any required task under that skill level.
TO PROMOTE OR NOT TO PROMOTE?
How does this work in practice? Let’s look at Alex, who is a consultant at Archetype.
In his self-review, Alex believes he has achieved all skills a Consultant needs. Our team can scroll down to manager review and peer review to see what his co-workers think about him as a consultant. We also aggregated self, manager, and peers review data to come out as 360 review which serves as a summary.
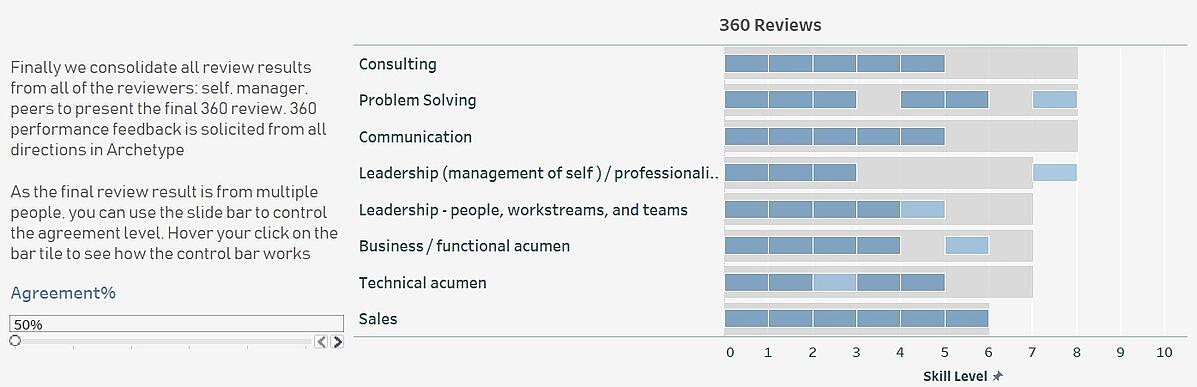
What if leadership is considering giving Alex a promotion to become a manager? Users can change the Applied Role to ‘Manager’; the grey bar increases automatically as the role of “manager” requires a higher skill level. In the 360-review summary, we can see Alex has not achieved the required level for skill Consulting, Communication, Technical acumen or Sales. As a result, leadership may deny his promotion as Alex has not reached the required skills level of manager.
What are Alex’s coworkers saying about him? In Tableau, you can see just that. When you click into the Consulting row, it jumps you to another dashboard which lists all detail tasks under each skill level.
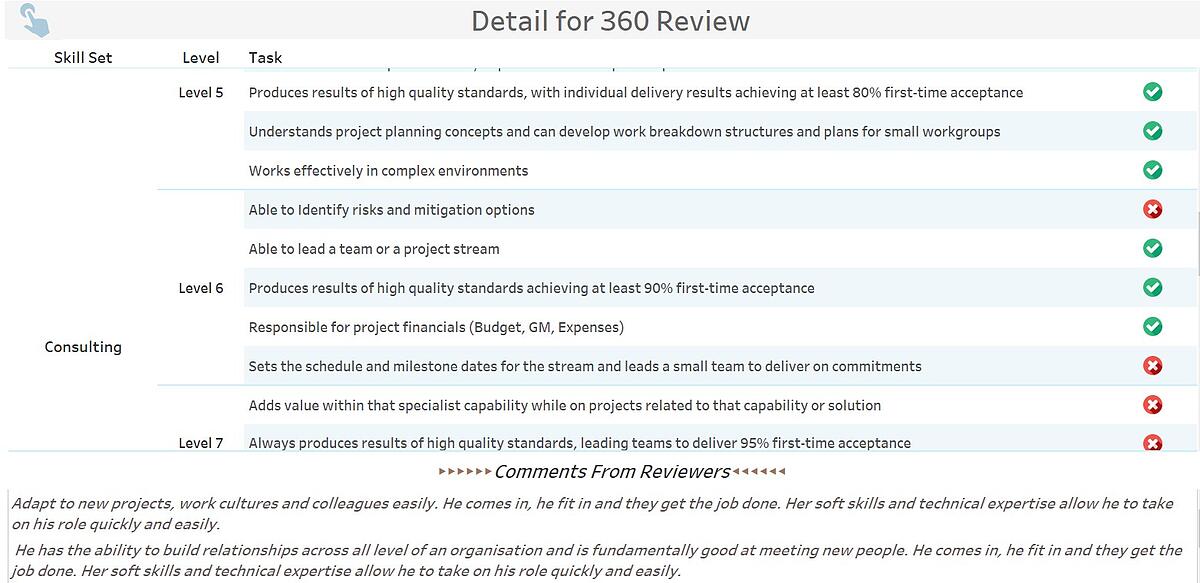
For Alex, he achieved all tasks for Consulting skill through level 5, but he failed to achieve required tasks of Level 6 and above. A manager needs to meet skill level for 7. This detail explains why the previous dashboard showed Alex has not reached the required Consulting skill level for a manager role.
As you can see, Tableau is such a powerful visualization tool which makes our performance review process so flexible and brings us the advantage of customizing the evaluation method as we want. For those Tableau experts, we utilized Join, Blending and Level of Detail functions in Tableau to make the magic.
Enter Tableau. At Archetype, our team needed a better way to support our performance review process. Using our own Tableau expertise, we designed an employee performance review method which incorporates the ‘360° feedback’ concept by aggregating the data from managers, peers, and employee themselves. Once we uploaded the information into the Tableau dashboard, we created strong visualizations, allowing our management team to quickly know what employees did well and see the space where they could improve.
Let’s share with you what we did.
USE REVIEW FORMS TO COLLECT THE PERFORMANCE DATA FROM EMPLOYEES
In an organization where employees have several different skills, our team had to decide which skills all employees needed to have. Ultimately, we chose eight required skills. Under each skill level, there are different tasks to show competence and employees must achieve all of the tasks under that skill level achieve it. After an employee completes the form, our team loads the data into the database. We then use Tableau to connect to the database and create visualizations for the management team to see each employee’s performance.
CREATE VISUALIZATIONS TO ALLOW MANAGEMENT TO EVALUATE AGAINST THE SKILL SETS
As you see in the dashboard, the management team can select the name of an employee and the role level they want to evaluate against. Each section of review listed all eight required skills and the grey bar shows the required skill level for the Applied Role managers select. For example, if a manager selects ‘Consultant’ in the Applied Role filter, the grey bar indicates that the required Consulting level for a Manager is 3 and required Technical acumen level is 2. The darker blue bar indicates the skill level the employee has achieved, and the lighter blue bar indicates the skill level the employee has not achieved but in the process of achieving it. If it’s blank, it indicates the employee failed to achieve any required task under that skill level.
TO PROMOTE OR NOT TO PROMOTE?
How does this work in practice? Let’s look at Alex, who is a consultant at Archetype.
In his self-review, Alex believes he has achieved all skills a Consultant needs. Our team can scroll down to manager review and peer review to see what his co-workers think about him as a consultant. We also aggregated self, manager, and peers review data to come out as 360 review which serves as a summary.
What if leadership is considering giving Alex a promotion to become a manager? Users can change the Applied Role to ‘Manager’; the grey bar increases automatically as the role of “manager” requires a higher skill level. In the 360-review summary, we can see Alex has not achieved the required level for skill Consulting, Communication, Technical acumen or Sales. As a result, leadership may deny his promotion as Alex has not reached the required skills level of manager.
What are Alex’s coworkers saying about him? In Tableau, you can see just that. When you click into the Consulting row, it jumps you to another dashboard which lists all detail tasks under each skill level.
For Alex, he achieved all tasks for Consulting skill through level 5, but he failed to achieve required tasks of Level 6 and above. A manager needs to meet skill level for 7. This detail explains why the previous dashboard showed Alex has not reached the required Consulting skill level for a manager role.
As you can see, Tableau is such a powerful visualization tool which makes our performance review process so flexible and brings us the advantage of customizing the evaluation method as we want. For those Tableau experts, we utilized Join, Blending and Level of Detail functions in Tableau to make the magic.