
Data Explorer - With Tyton Partners
Creating a clean and interactive data visualization platform
Through Tyton Partners’ expertise in postsecondary education, insightful survey results were identified that highlighted effective products, services, policies, and practices for institutions. Archetype was tasked with creating the platform to visualize these insights.
Problem
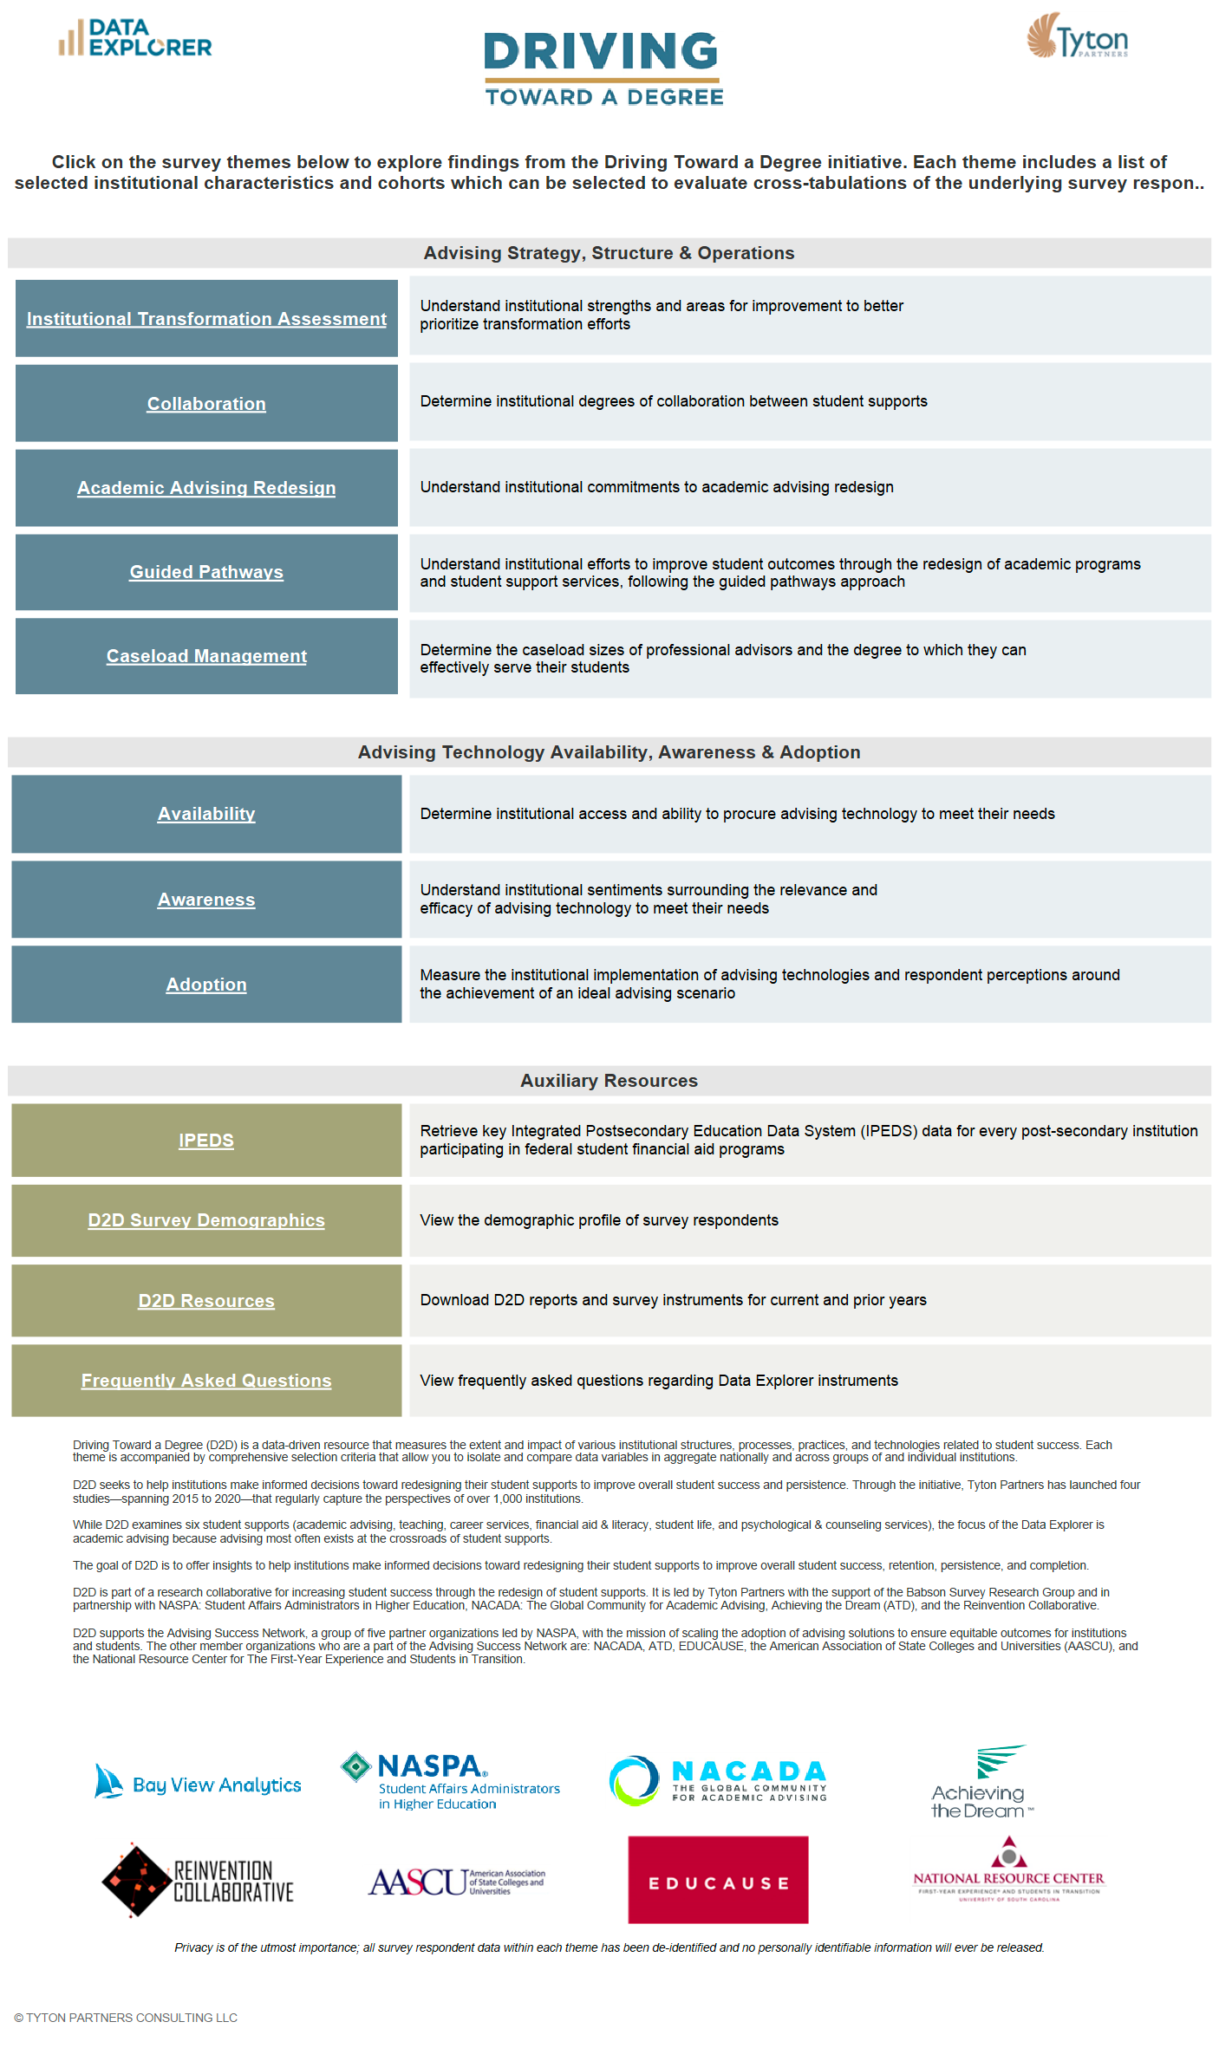
Changing demographics, financial pressures, technological trends, and lack of student engagement are causing college and universities to redesign their core functions. This includes the redesign of developmental math and English, digital learning, and academic advising. Tyton Partners, an education advisory firm, and Archetype collaborated to develop an intuitive and interactive reporting environment – Data Explorer © – based on data collected through institutional surveys covering these core functions: Hitting Their Stride (developmental math and English), Time For Class (digital learning), and Driving Toward A Degree (academic advising), respectively. Through Tyton Partners’ expertise in postsecondary education, insightful survey results were identified that highlighted effective products, services, policies, and practices for institutions. Archetype was tasked with creating the platform to visualize these insights.
Tyton Partners required a clean and interactive data visualization platform for users to view and drill down into the survey data with ease. Furthermore, Tyton Partners required Data Explorer © to be accessible publicly with the ability to administer and monitor access for the platform’s users. The initial beta version of the solution is expected to be released to <100 users; however, this solution was built with scalability in mind. The core principles guiding the solution design were:
Ease of maintenance
Interoperability and flexibility
High quality and usability
Solution
Approach:
Hundreds of survey questions were vetted down to key questions that highlighted data stories for specific areas of interest by Tyton Partners. These surveys contained various types of questions such as multiple choice, check box, rating scale, Likert score, and open-ended questions.
Archetype collaborated with Tyton Partners to produce clean flat files with survey results for Hitting Their Stride, Time For Class, and Driving Toward A Degree. Annual survey responses were optimized for Tableau visualizations using R and Tableau Data Prep and then saved as Tableau Data Extract files. These data extracts will simply need to be refreshed as future survey results are gathered. Archetype developed comprehensive visualization workbooks for the three interest areas – each workbook containing dashboards focused on key categorical themes of the underlying survey questions.
End-User Experience:
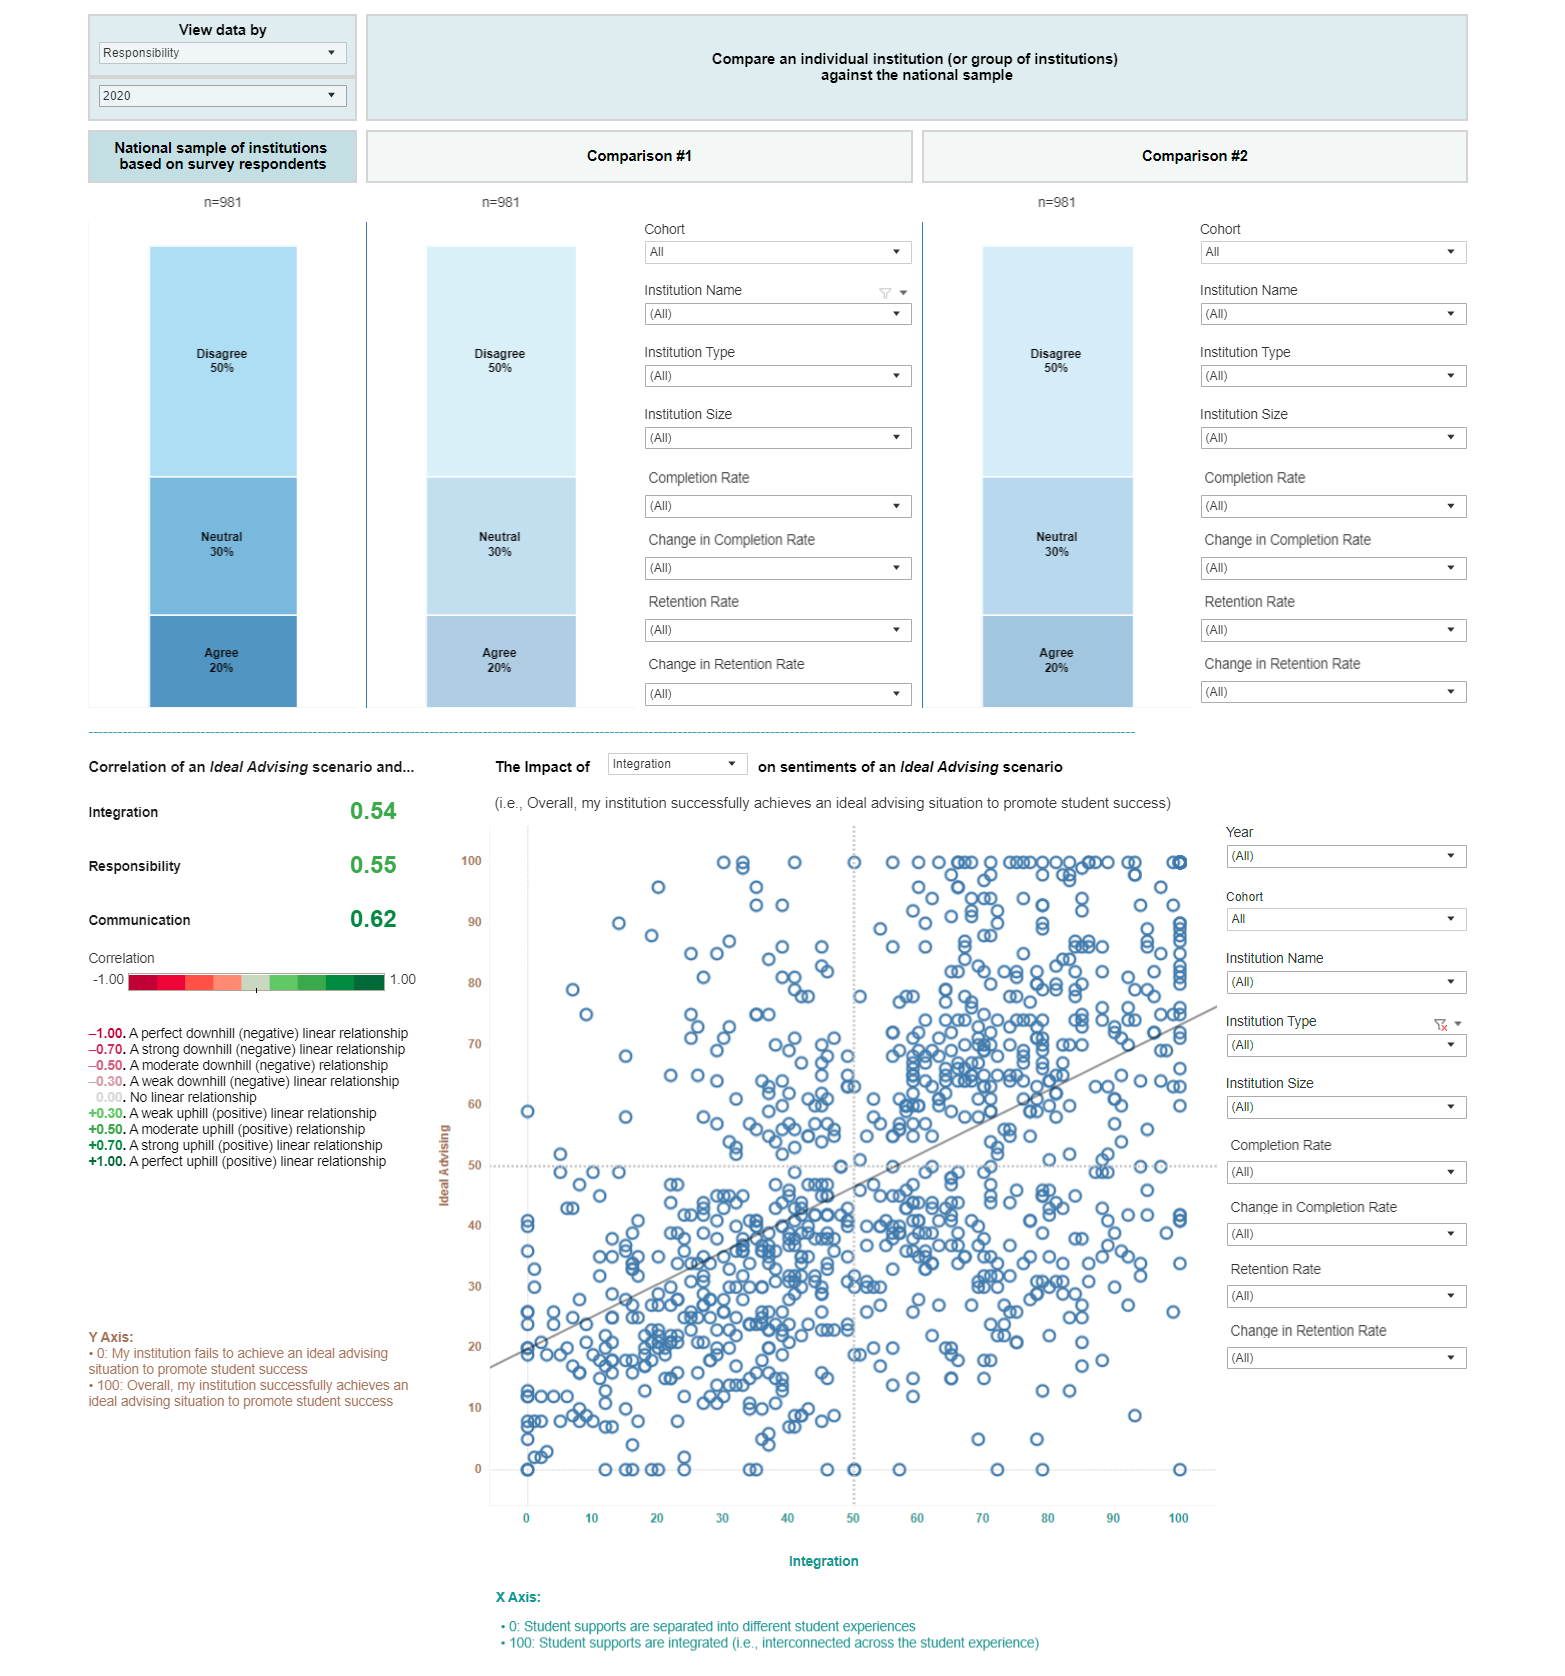
The Data Explorer © visualizations and TDEs were uploaded to a Tableau Server environment hosted by Tyton Partners, with end user accessing content through a dedicated URL. A custom Data Explorer © landing page was created that offered users a guided path to their respective area of interest along with a Terms and Conditions acceptance step to ensure proper usage. Additionally, users are offered the ability to request a deeper level of access to the underlying data through a linked Google form. Ultimately, Data Explorer © offers the end user the ability to interact with simple filtrations on visualizations and provides a self-service environment to perform statistical analysis on critical cross sections of survey results.
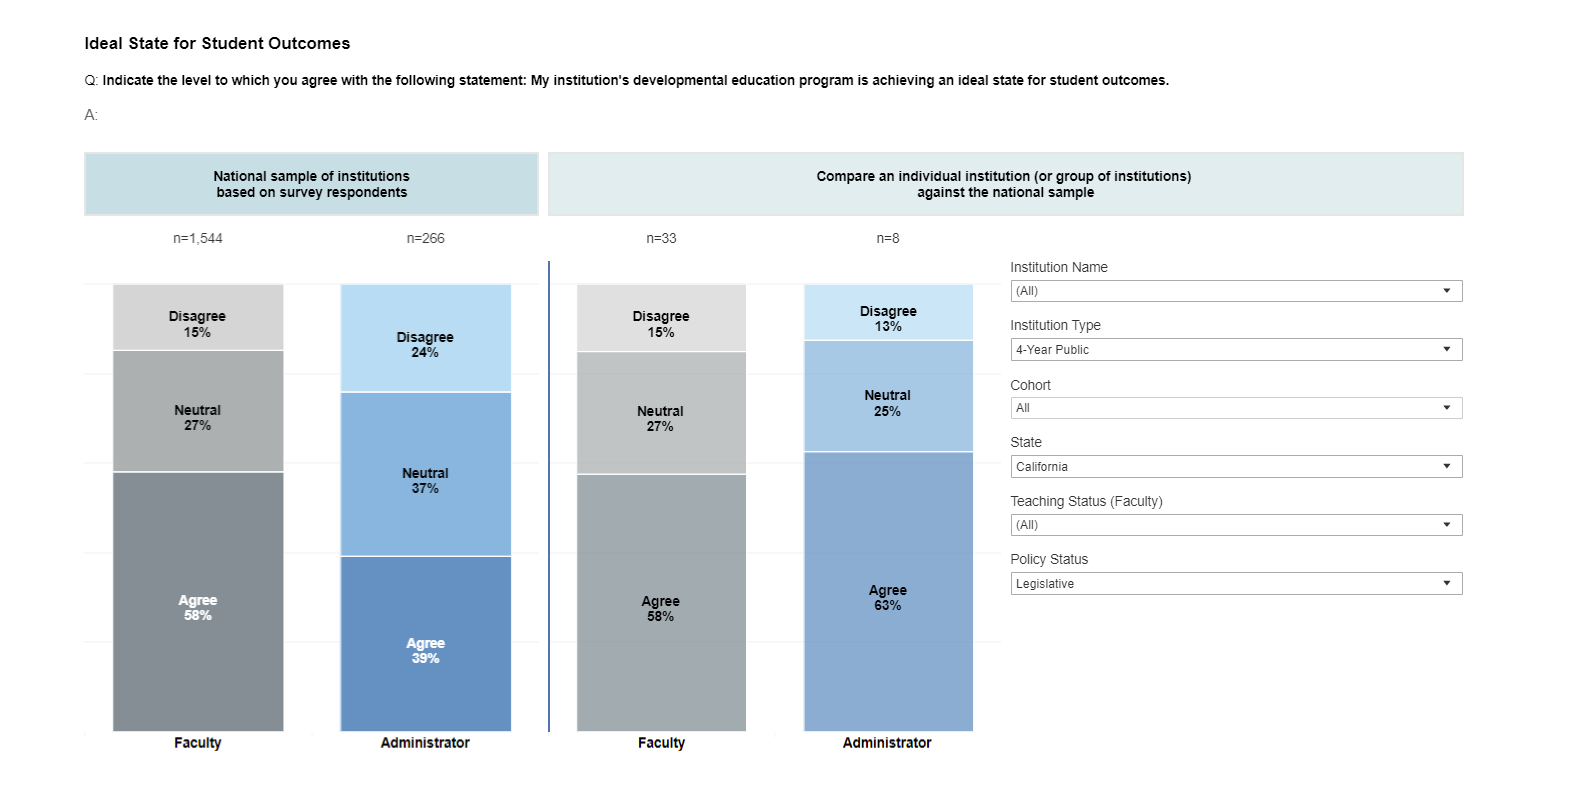
For instance, a key insight identified by Tyton was a question regarding the perception of institutional developmental education (i.e., development math and English courses) between college and university administrators and faculty members. The view below allows the end user to simultaneously view national results for this question (left), while having the ability to benchmark it against his or her criterion (right). In this case, the benchmark side showcases question results for 4-year public institutions in California.
Result
Data Explorer © is an interactive, web-based reporting environment through which users can interact directly with valid, reliable, and longitudinal survey results data and immediately apply their subject matter expertise to develop deep insights and increase postsecondary student success.
